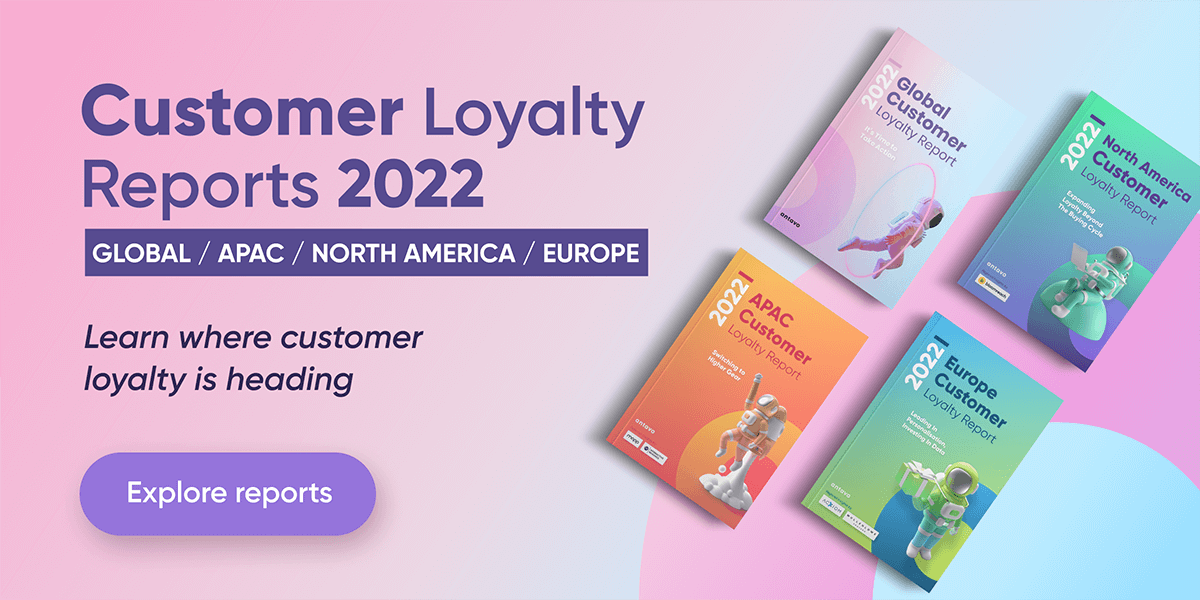
Digital transformation has reached an unprecedented degree in the years since the epidemic, which has forced companies all over the world to reconsider how they connect with their customers. Additionally, loyalty programmes are enjoying a revival as a result of the reignited interest in creative customer engagement solutions. However, despite the fact that businesses spend in customer loyalty all over the world, each region has its own priorities, resulting in quite distinct loyalty landscapes in places like Europe, North America, and Asia-Pacific. Three regional customer loyalty reports have been made available by Antavo for 2022 in order to assist you in identifying untapped potential in your area.
Concerning the 2022 Regional Customer Loyalty Reports from Antavo
Antavo focuses on three regions in its series of regional customer loyalty reports: Europe, North America, and Asia-Pacific, giving each of them a full report. These studies are based on a global survey of more than 320 corporate respondents from throughout the globe. The study also includes information from 10.7 million loyalty member actions in North America, 6.3 million APAC member actions, and 4.4 million member actions related to Europe, all of which were recorded by Antavo’s loyalty management system.
The Regional Customer Loyalty Reports from Antavo look at loyalty programmes from the perspective of both current and potential owners. Additionally, the global average established in Antavo’s Global Customer Loyalty Report 2022 is contrasted with each region-specific data in the reports.
The Landscape of Loyalty Programs Currently
Brands are now faced with a completely different consumer reality as a result of the past several years’ disruptive effects on customer interaction. It’s important to look at how companies in each region assessed the effectiveness of their own loyalty programmes because this has radically changed the objectives and expectations of these programmes.
Satisfaction
North American programme owners are the most satisfied (63.3%) with their loyalty programmes among the three regions examined, showing that businesses with a carefully thought-out loyalty programme can still succeed in such a sizable market. Conversely, fewer APAC businesses (42.4%) report being happy with their programme, which may indicate that expectations are particularly high in the area. Regarding Europe, satisfaction levels are a little above average (56.3%) and roughly resemble the global average.
The Need to Renovate
When asked how likely they are to change their loyalty programme in the next three years, poll participants from North America once again earned the top rank (80.0%), followed by those from Europe (71.9%) and APAC (66.7). Generally speaking, this majority suggests that even businesses that are happy with their current loyalty programmes want to update them soon, possibly in an effort to include new features and take advantage of the most recent trends.
Feelings of Loyalty
Respondents were asked whether they would categorise their programme as rational (transaction-focused) or emotional to get a sense of how businesses view their loyalty programmes (experience-driven, where customers are often engaged outside of the buying cycle). APAC stood out in this instance by a wide margin. With a score 9.6% higher than the global average, 30.3% of APAC respondents who had a loyalty programme said their programme was more emotional than rational. Both of the other two areas’ scores fell short of the world average. Only 15% of respondents from Europe and 10% from North America indicated that their programme was more emotional.
Expectations for the Technology & Loyalty Platform
The degree to which a firm is satisfied with its loyalty programme may be significantly impacted by loyalty technology. Technology typically entails more than just the ability to put a concept into practise. Regarding the utilisation of platforms and loyalty technologies, the following trends have been noted.
Technology: In-House vs. Third Parties
Both in-house development of the loyalty technology and using a third-party vendor have advantages. Additionally, each choice results in a radically different managerial experience. With 51.5% of APAC companies opting for in-house technology, the scales are slightly tipped in that direction. In contrast, 60% of businesses in North America favour the third-party strategy. It’s interesting how evenly split Europe is.
Continuity with IT Teams
The platform for managing your loyalty programme should be adaptable and simple to use, otherwise staff members will struggle. The majority of European businesses—50%—felt that their marketing teams were dependent on IT to handle the programme, followed by the majority of APAC businesses—42.4%. These figures were higher above the average for the world in both circumstances. North America is less dependent on IT support for programme management (33.3%), most likely due to the region’s preference for third-party solutions.
Platform with No-Code
In light of the above query, it was also inquired of present and potential programme owners whether they concurred that the ability to set up loyalty rules without coding would be beneficial. No-code platforms appeared to be preferred by respondents in all three areas, notably in APAC (85.7%). While significantly less than the global average, 63.3% of respondents in North America and Europe agreed with this statement, which is still a large majority.
